Atoms, molecules, organisms, templates, and pages, what all those things have in common? You’ll be surprised, the Periodic Table.

Ask most chemist who discovered the periodic table and you will almost certainly get the answer, Dmitri Mendeleev. Without a doubt, Mendeleev was technically the first who organized the known elements. Moreover, he was the first who published a version of the table and made some predictions that would prove correct in time. Despite this, he is not the only one who deserves all the credit. Surprised, aren’t you?
Since the 17th century, alchemists from around the world attempted to discover and identify new elements. Do you know that namely DeChancourtois, Antoine Lavoisier, and Lothar Meyer, were the first who tried to produce the table? Despite being a bit late to the party, their names are valuable gold.
A moon crater and an element number 101 named after him are among other contributions to chemistry made by Mendeleev. Millions of people still believe in the famous myth that Mendeleev first saw the periodic table in his dream. What about the standard for Russian vodka at forty degrees? Well, the man died, but the myth was born.
One thing is true, Mendeleev had his fingers in many pies. Sure thing, he flew in a hot-air balloon, invented smokeless powder and even made leather trunks. All other facts are myths, which, however, do not take away the laurels of Mendeleev as one of the most brilliant chemists in the history of mankind.
A Place for the Periodic Table in Popular Culture
Now, let’s get back to the topic. Think there’s nothing in common between the chemistry and the web design? Think again.
Numerous table designs both colorful and informative have been created over the years. From artistic, musical and interactive versions, to emojis and a play version used in the Battleship game. Sure, variety abounds. So, why not to make the best of use of the periodic table from the web design point of view?
In search of inspiration and parallels, web design pros recognize the need to develop thoughtful design systems that can be comprised of smaller elements like color, typography, grids and the like. That’s where the periodic table come into play. Do you think it’s really a table? In fact, created from headings and rows, it’s called a table because it does one thing best – represents data visually.
HTML Tags: To Learn or not to learn
As a result, from a visual design point of view, the periodic table of HTML tags is second to none when it comes to website producing. Being only a modest blogger, it comes to no wonder for me that the logical step-by-step compliance is no stranger in the chemistry industry. The same way it’s no stranger to the website development.
Starting from the beginning, most web developers move smoothly and logically through a variety of steps to website launch and maintenance. The better way to achieve that is to visualize the web design process effectively. That’s where the Periodic Table of Elements Infographics comes into play.
Good infographics use something familiar, something you understand, something that helps you grasp confusing information without a hitch. In the end, posting article by article becomes a smooth track without much legwork on your end.
On What to Bring…
How often do you end up thinking ’oh my god, this is a mess’? Let’s be real. When most of us started our first blog, we didn’t sign up how to code. I know I didn’t. Yet, the reality is that understanding HTML is key to having a successful blog.
Used most common in the business industry, HTML templates can get your website live and kicking. Even though there are close to hundreds of tags in HTML, you usually end up using a handful of 99 percent of the time. The good news is that thanks to the periodic table of HTML tags you can use increase the quality of your next blog like a pro. The secret?
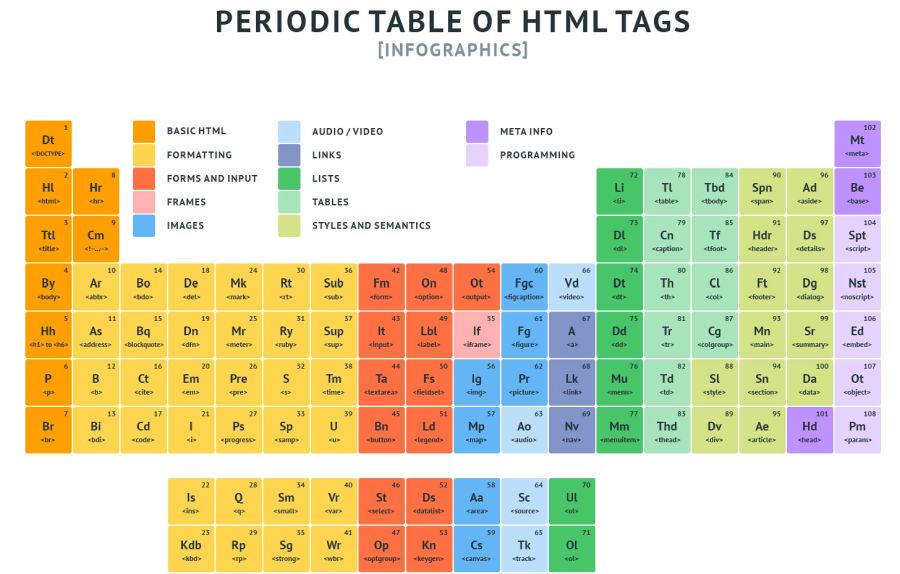
Just like the periodic table organizes chemical elements according to trends in their physical and chemical properties, the periodic table of HTML tags manage individual elements, which define alternate pieces of content such as headings, paragraphs, and the like.
 a>
a>
Divided into12 categories, HTML tags come in eye-candy colors with short titles for easier understanding. Thus, you can find categories such as tabular data, interactive elements, forms, metadata and scripting.
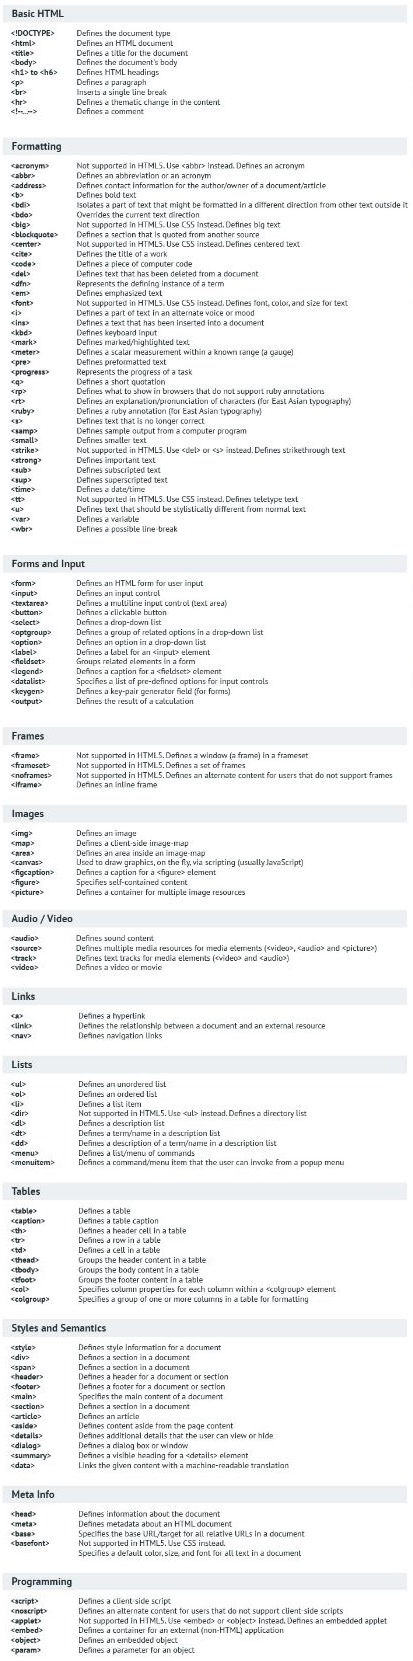
Meanwhile, enjoy more detailed tags description right under the periodic table. At the end of the day, get the most from HTML tags in a clear and concise way. One thing to do is to bookmark the table and bridge your gap in knowledge.
Thus, every time you need to bring your blog up a notch, the periodic table of elements can do the trick. From now on, you have so-called ‘Masterplan’ to follow with every detailed step you should take to run your next blog post far more efficiently.
And General Advice: Just Do It
Ready to resolve practical challenges? If you are like me and don’t like change, the periodic table of elements infographics can help you out. Get creative with it to make a progress in learning tags. Hope this helps.